
If you've run sales or RevOps for any amount of time, you've probably lived some version of this. The plan gets built off a TAM, the TAM is big, and the quota math works on paper. Then pipeline comes in light, and the fix is usually something about the motion: a new channel, a new sequence, more SDRs, another data vendor. The list everybody's working from typically doesn't get questioned, because it came out of the plan, and the plan already got approved.
More so, a lot of the teams we talk to now keep fit and intent in two separate Salesforce fields, because nobody figured out how to use them together to say an account is actually in market. So reps get a fit score, an intent score, and off they go. And when those scores don't match what they hear on calls, SDRs and AEs stop trusting what RevOps sends them and build their own priority lists off their gut and experience.
We ran into this pattern over and over across the 311 companies we've worked with, and for a long time we treated it like an execution problem too. The aha moment for us was realizing most of those lists were built to answer who could buy, and nobody had ever checked which of those accounts actually had the problem the product solves. That's an awkward thing to bring up in a planning meeting, because the TAM is usually the one number everybody already agreed on.
That's the mental model shift this piece is about. Who could buy, who actually has the problem, and who has it right now are three different questions, and most plans only answer the first one. When you set headcount and quota off that first answer, the gap between the three shows up later as missed pipeline.
So the way we build a market now works in the other direction, from the pain up. We start with the pain the product solves, figure out what that pain looks like from the outside, and use signals to find the accounts that have it. That gives you three numbers instead of one: your TAM, your Pain Addressable Market, and your Accounts in Market.
I'm going to define all three first, because honestly I think the definitions are where most of the confusion comes from. Then I'll walk through the mental model itself, how we used it to take one client from casino gaming into banking, and how you can build it for your own market and get your CRO to sign off on it.
Section 1What are TAM, Pain Addressable Market (PAM) and Accounts in Market (AIM)?
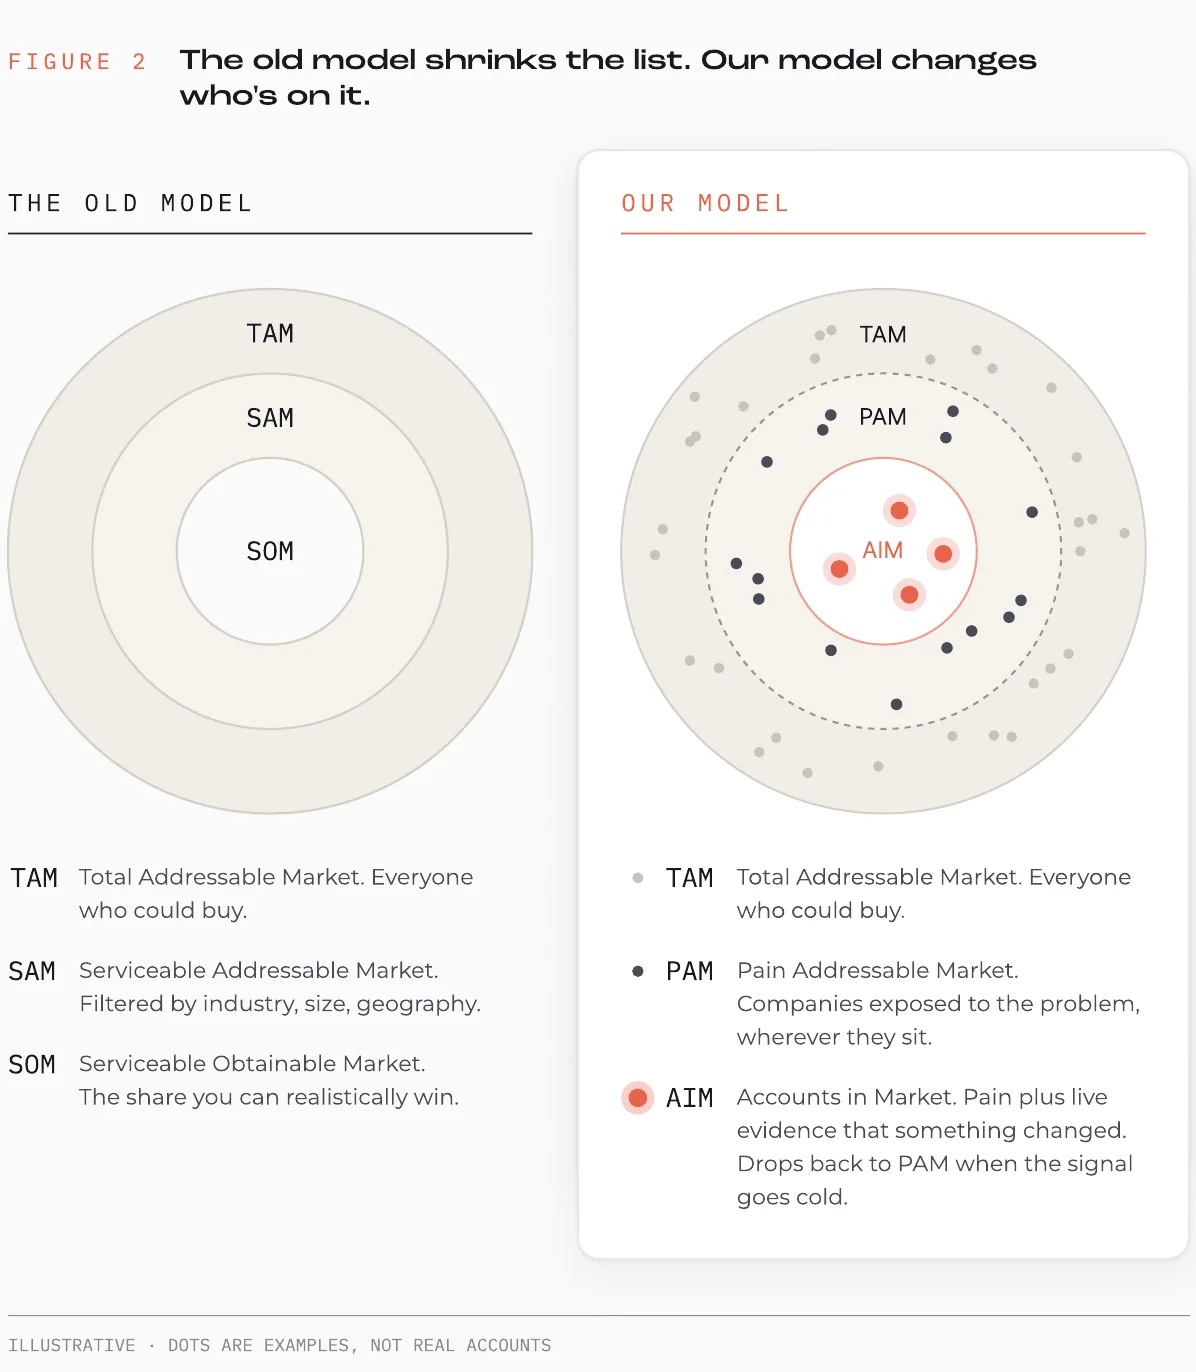
Your TAM is every account that could theoretically buy what you sell. Your Pain Addressable Market is the part of that TAM with real, observable exposure to the problem you solve. Your Accounts in Market are the accounts inside your Pain Addressable Market where something recently changed that makes the problem active right now.
TAM → Pain Addressable Market → Accounts in Market
- TAM Total Addressable Market
- Every account that could theoretically buy what you sell.
- PAM Pain Addressable Market
- The part of that TAM with real, observable exposure to the problem you solve.
- AIM Accounts in Market
- The accounts inside your Pain Addressable Market where something recently changed that makes the problem active right now. An account drops into AIM when a signal fires and drops back out when that signal goes cold. The same account can be AIM in Q1 and back in PAM by Q2.
Each one sits inside the one before it. Here's how I'd lay them out side by side:
A few things I want to point out about these, because this is where people usually get tripped up.
- Your Pain Addressable Market isn't a filter you run on your TAM. It's a score. Every account in your TAM gets one, based on how exposed it is to the problem, and your Pain Addressable Market is the set of accounts that score high enough to be worth your team's time. That matters because you can watch accounts move up and down, and you can set the cutoff based on how much SDR capacity you actually have.
- Accounts in Market isn't a separate list you go buy from a vendor. It's what happens when something changes at an account that's already in your Pain Addressable Market. A bank that just hired a new head of fraud is interesting. A bank that hired a new head of fraud and also has a ton of walk-in traffic is a lot more interesting, because now the event is landing on top of a problem we already have evidence for. And a bank that hires a fraud leader but barely has any branch traffic probably isn't in market for this product at all, no matter how good the event looks on paper.
- This isn't TAM, SAM and SOM with new letters. SAM narrows your TAM by fit, things like region and segment, and SOM is typically an assumption, somebody saying we'll get 5% of SAM. Neither one tells you which accounts. Your Pain Addressable Market and your Accounts in Market are built account by account, so when your CRO asks which 5%, you can actually hand them the list in realtime.
Section 2How do you build a bespoke Pain Addressable Market for your business?
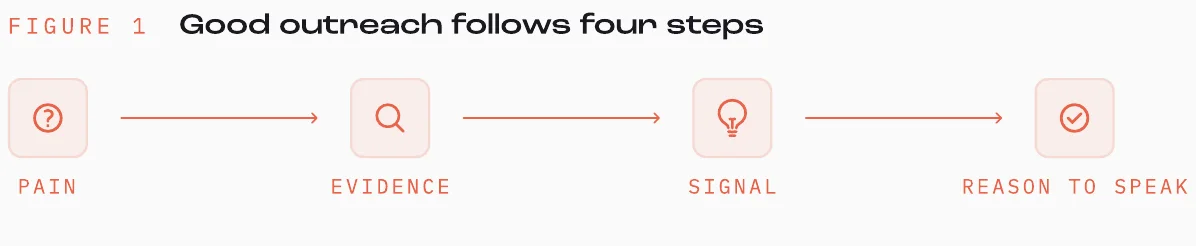
Signals are the public evidence that an account actually has the problem you solve: a bank hiring a new head of fraud, a personal injury firm racking up Google reviews, a company spending $100,000 a month on Google Ads. Instead of narrowing your TAM down by fit and hoping the pain is in there somewhere, you start with the pain, figure out what evidence it should leave behind, and score every account against that evidence. What comes out is your Pain Addressable Market, and if it comes out too small, or you can't find the evidence at all, you've just learned your TAM isn't a real outbound market.
Notice that the ones that actually tell you about the pain usually aren't sitting in an intent feed. You have to go build them.
Start with the pain, not the signal
Most teams do this backwards. They buy a signal platform, get access to job changes, funding rounds, hiring spikes and intent data, and then ask:
Which of these signals should we use?
We ask a different question first:
What would have to be true for this company to really need the product?
Only then do we go looking for evidence of it.
Here's a simple example. Say a company just raised $30 million and you sell Google Ads software. A lot of teams would treat that funding round as a buying signal and email the head of growth. But all the funding round really tells you is that the company might have money now. It doesn't tell you whether they spend enough on Google Ads to need you. If you also know they're spending $100,000 a month on Google Ads, that's a completely different conversation, because now you have two different pieces of information:
- Funding → capacity to buy
- $100,000 a month in ad spend → evidence of the pain
You have to keep those two straight in your model.
The question I'd ask about any market is:
If this problem were really bad inside a company, what would we expect to see from the outside?
Your existing customers are usually the best place to start. One legal AI company we looked at sold to personal injury firms, which is a market of more than 50,000 firms. Their best customers had something in common nobody expected, which was really high Google review volume. PI firms typically ask for reviews when a case closes, so review volume ends up being a decent stand-in for case volume. Add Google Ads spend on top of that, in a category as expensive as personal injury, and you can pretty quickly separate the firms handling real volume from the ones that just show up in a directory.
What goes into the score
The way I think about the inputs is as a pyramid, and each layer does a different job.
- Fit is the base: firmographics, technographics, demographics, location, size. Everybody already has this, and it's what your TAM is built on. It feeds your Pain Addressable Market too, because some fit data, like branch count, says something about exposure.
- Intent sits on top of fit: searches, content consumption, category research. It's useful, but only as timing. Somebody researching your category doesn't mean they actually have the problem you solve, it just means they might be looking right now. So intent only feeds Accounts in Market.
- Bespoke signals are where it gets interesting. These are signals you construct yourself, usually from public data, mapped to your specific pain. Some of them describe a condition, like a bank serving a large underbanked population, and those feed your Pain Addressable Market. Others describe a change, like a fraud-leader hire or an enforcement action, and those feed Accounts in Market.
- Proxies are at the top. These are inferences you make when the thing you actually care about isn't published anywhere. Economists do this with satellite images of lights at night, using how bright a region is to estimate GDP in places where the official numbers aren't reliable. For our banking client, what we cared about was how many strangers walk into a branch and hand a teller a physical ID. Nobody reports that, so we had to infer walk-in volume from data that does get reported.
- Proxy Observable stand-in
- A proxy is still a hypothesis until you show that it behaves the way you think it does.
The bottom two layers are pretty much commodity at this point. You can buy fit and intent data from a bunch of vendors, and so can every one of your competitors, which is why everybody ends up emailing the same accounts off the same funding alerts. The top two layers are the ones you have to build. And bespoke doesn't mean proprietary data, by the way. Most of what we use is public. What's proprietary is the logic that connects that data to the problem your customer is likely dealing with.
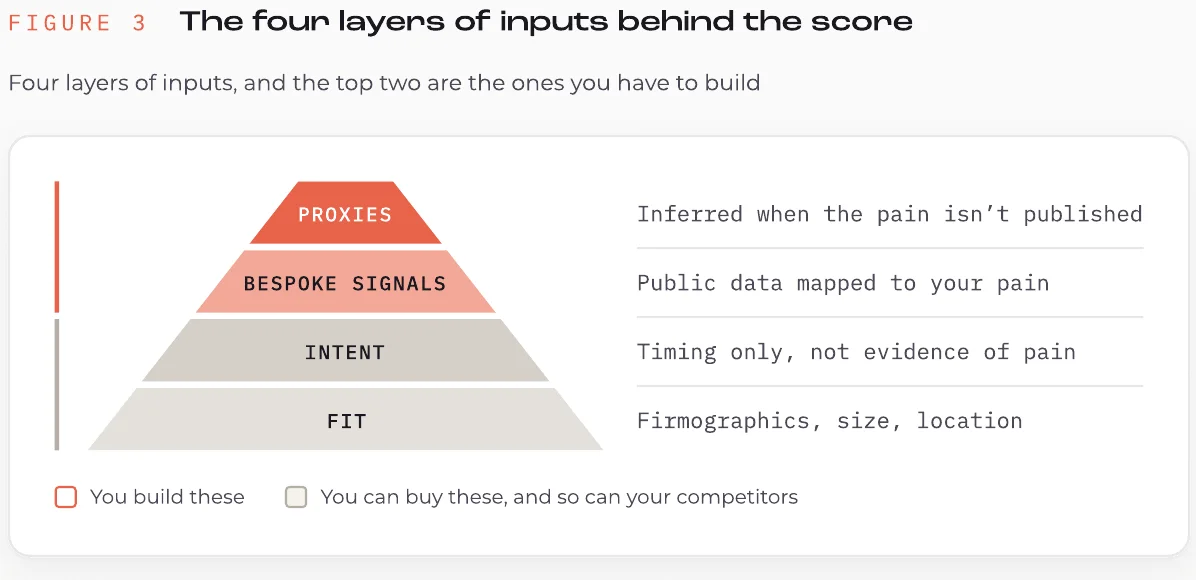
Fit builds the TAM. Proxies and condition-type bespoke signals decide who's in the Pain Addressable Market. Change-type bespoke signals and intent decide who's in market this week.
How signals move accounts in and out of market
Once the score is built, it doesn't sit still. An account moves into Accounts in Market when a change-type signal fires on top of pain you already have evidence for, and it drifts back out when that moment passes: the new fraud leader settles in, the enforcement action gets resolved, the budget gets spent. So the real question isn't which signals you track. It's how much each one should count when it fires.
This is where people get tripped up. Think about it like seismic activity. Most of what a signal feed picks up is tiny tremors: a website visit, a content download, a spike in category research. They fire constantly, they're easy to count, and because you see so many of them it's natural to assume they matter most. But the events that actually move accounts into Accounts in Market are usually the rare ones, the 9.0 earthquakes. They come out of moments like a new federal rule, an annual regulatory exam or a new compliance deadline, and when they hit, they can move thousands of accounts at the same time. If you weight signals by how often you see them, you end up with a model that looks busy all the time and still misses the earthquake.
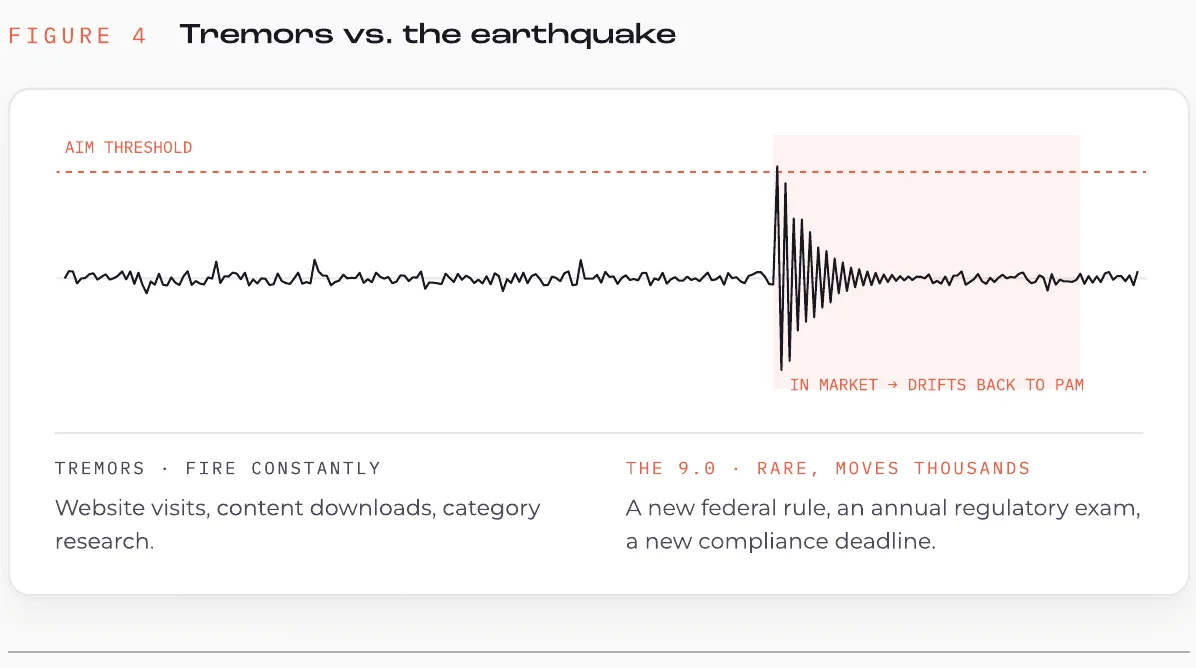
The catch is that an earthquake only matters if it lands on real pain, and a lot of the time the pain itself is the thing nobody publishes.
What do you do when the pain isn't published anywhere?
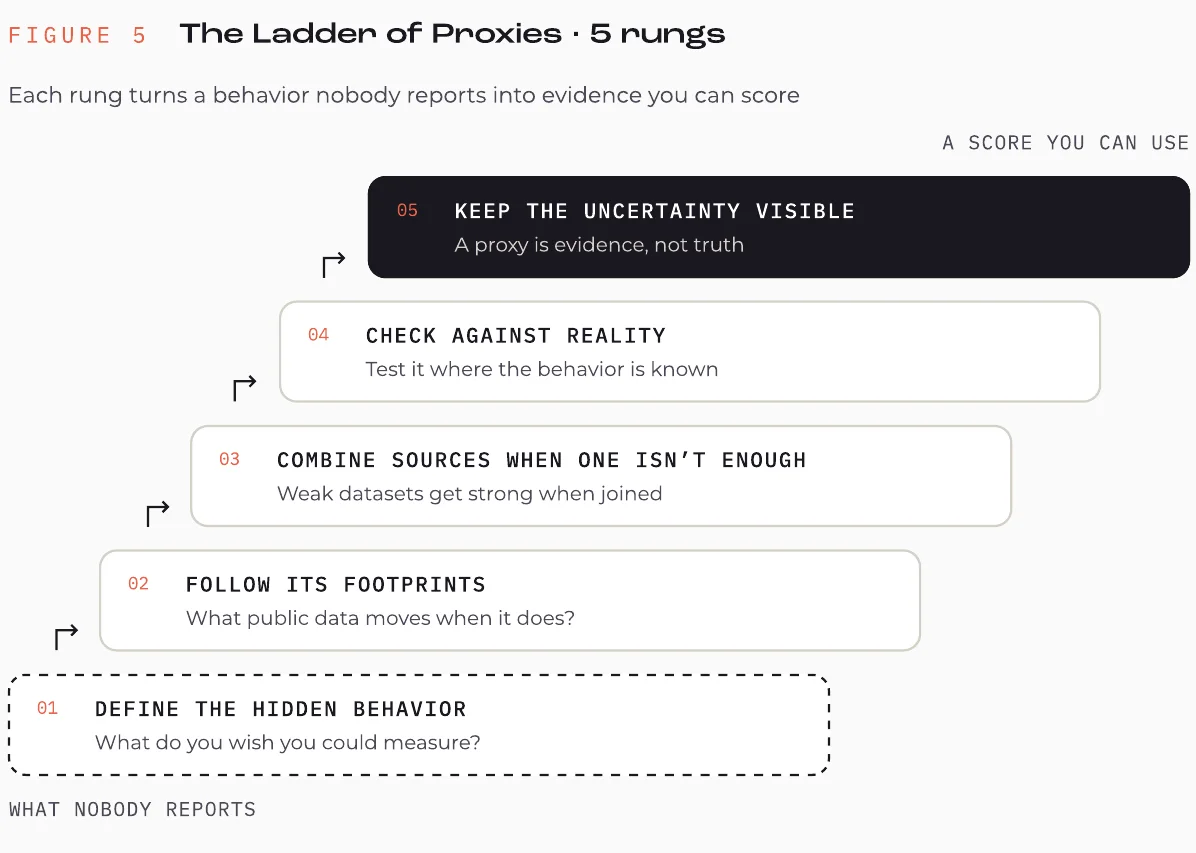
A lot of the time, the thing you actually care about doesn't show up in any dataset. Nobody reports how many strangers hand a teller an ID. When that happens, don't go shopping for data first. Ask what footprints the behavior should leave behind, and work your way up what we call the Ladder of Proxies:
Where the TAM actually gets validated
This is the part I think most people miss. Once you score your TAM this way, you find out pretty fast whether the market you've been planning around is real. Sometimes your Pain Addressable Market is big and the signals fire all the time, and you're in great shape. Sometimes the pain is real but only a hundred accounts have it. And sometimes the pain might be real but there's no data that lets you see it from the outside. In all three cases you'd want to know that before you hire the SDRs.
Section 3What does this look like in a real market?
Here's the real version. A client of ours had spent nearly 20 years authenticating physical IDs in casino gaming, and they believed they'd run out of casino market to grow into. Banking was the leading candidate for what came next, and data centers were the other market on the table. By the end of testing they had 2,323 scored institutions, 13 candidate signals checked against 90 days of real events, and enough evidence to commit sales capacity to banking without betting the quarter on it.
What did they need to figure out about banking?
What they didn't have was a way to size banking that would hold up in a board review, or a way to tell which banks would actually feel the problem they solve. A TAM would have told them banking is enormous, but it says that about almost every adjacent market, because it counts everybody who could buy. Market size only told us so much. We needed to know how many banks had meaningful exposure, how often those opportunities would surface, and which ones deserved our attention first.
Casinos and community banks don't have much in common as industries. What they do have in common is a moment. A stranger walks into a building, hands an employee a physical ID, and that employee has to decide whether the document is real. In a casino that happens at the cage, and in a bank it happens at the teller line. The product authenticates the physical document itself, which is different from checking whether the information on it matches a database.
Banks already spend a lot on identity verification, KYC, AML monitoring and fraud detection. But if a teller accepts a convincing fake ID, all of that downstream machinery is starting with bad input. Once we saw that, we stopped asking:
Which banks are in our ICP?
And started asking:
Which banks are most exposed to the problem the product solves?
There's no regulatory field for how many strangers walk into a branch and hand a teller an ID, so we had to build a proxy for walk-in volume.
How did we test the model they already had?
Within two weeks of us starting, their Chief Customer Officer had built a scored model covering 1,473 institutions, with explicit weights and tiers. It had hypotheses around branch count, underbanked populations, fraud exposure and population density, plus candidate signals like gaming-to-banking hires, enforcement actions, complaint spikes and remediation hiring. It was a really good starting point, but a smart-sounding model isn't the same as a tested one.
Take underbanked populations. The theory was that banks serving more underbanked customers probably see more of the walk-in behavior where physical ID checks matter. That's plausible, but if an assumption carries a lot of weight in your model, plausible isn't enough. So for every assumption that mattered, we asked:
- Why do we believe this?
- What would we expect to see if it were true?
- Is there anything in the real world we can check it against?
That turned into a four-step protocol:
- Source the conviction. Talk to the people closest to the problem and understand what they believe and why.
- Make it measurable. Until you can define something that could support or contradict the belief, it's still an opinion.
- Rebuild it independently. Don't just polish the inherited model. We rebuilt from source data, which is how 1,473 institutions became 2,323 (1,488 banks and 835 credit unions), and reconciled afterward.
- Find whatever ground truth exists. Regulatory data, historical events, known customers, anything that lets reality grade the hypothesis.
I want to be clear that the client's judgment wasn't the problem here. They knew things the data never would have told us. Their experience gave us the hypotheses, and the testing told us how much weight each one deserved.
How did we pick between banking and data centers?
Once you have two plausible markets, there's an easy way to make a bad call, which is getting everyone in a room and asking which one they liked better. Instead we ran both through four questions.
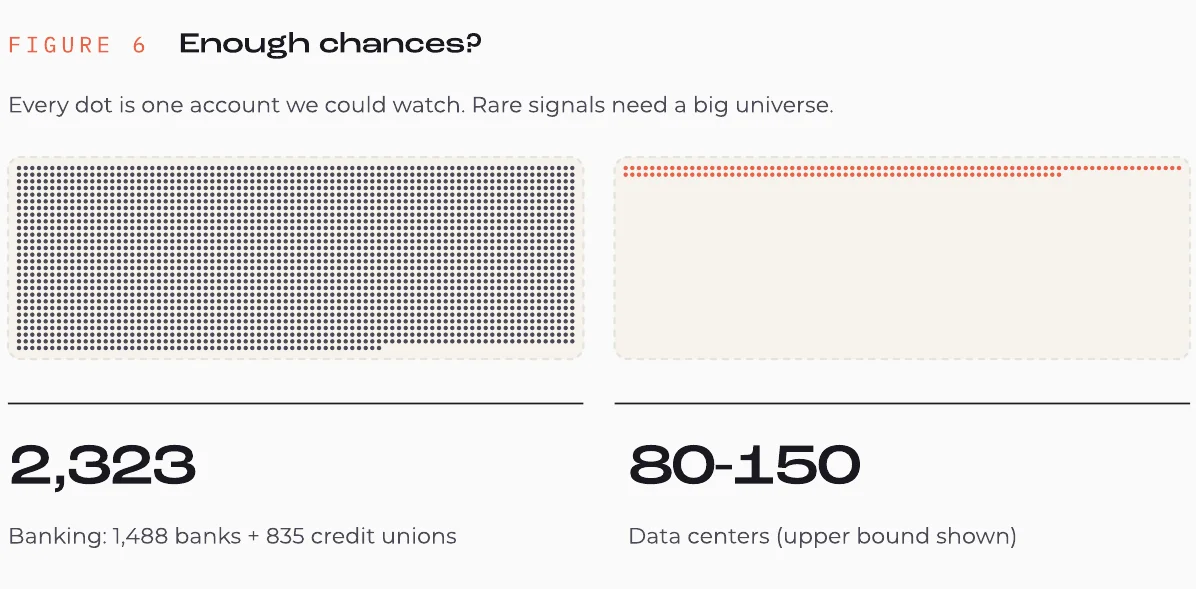
- Are there enough at-bats? Companies don't hire a new head of fraud every Tuesday, and banks don't merge every month. If you're going to wait for meaningful events before you reach out, you need enough accounts under watch for those events to happen at a useful rate. Banking had 2,323 scorable institutions. The realistic universe of data centers for this use case was more like 80 to 150.
- Can we measure what we care about? Banking leaves a ridiculous amount of evidence lying around. FDIC and NCUA data tell you who's out there, Call Reports give you institution-level financials, CRA evaluations give you another layer of regulatory ground truth, and public records capture mergers and enforcement actions.
- Do the signals fire often enough to matter? In the first week, we took 13 candidate banking signals and ran them backward against 90 days of actual events. Hiring a fraud leader sounds like a great signal, but how many banks actually hired one in those 90 days, and how many of those were institutions we already scored as strong fits? In banking we could count. In data centers we were still figuring out whether some of the events could even be detected reliably. Timing matters here too. 6sense's 2024 Buyer Experience Report found B2B buyers are already 69% of the way through the purchase process before they talk to a seller, so a signal has to fire early enough that there's still something to influence.
- Do we have a reason to be in the conversation? A signal can tell you when to show up, but it doesn't give you credibility. Our client had a documented banking customer story, and nearly two decades in a heavily regulated gaming environment gave them a real bridge into conversations with BSA and AML buyers.
Banking cleared all four. If you boil it down, a market is worth building an outbound engine around when three things are true at the same time:
Pain × commercial opportunity × signal visibility
| Market | Pain Real exposure to the problem you solve | Commercial opportunity Enough accounts for events to land often | Signal visibility Public evidence you can score and watch |
|---|---|---|---|
| Banking | Yes. Teller-line ID fraud | Yes. 2,323 institutions | Yes. 13 signals backtested |
| Data centers | Maybe. Might be there | No. 80 to 150 accounts | No. Detection unproven |
You typically need all three. Data centers might have had the first one, but not the other two.
Is a smaller market actually better for outbound?
Usually, yes, as long as it's big enough to keep your team busy. Here's an illustrative company to show why. It has a 150,000-account TAM and a 50-person SDR team, and 20,000 of those accounts carry real exposure to the problem it solves. That's the Pain Addressable Market.
| Illustrative company | Working the TAM | Working the PAM |
|---|---|---|
| SDRs | 50 | 20 |
| Accounts worked per year | 50,000 | 20,000 |
| Meeting rate | 2% | 5% |
| Meetings | 1,000 | 1,000 |
| Qualified opportunities (40% of meetings) | 400 | 400 |
| Close rate | 20% | 30% |
| Deals won | 80 | 120 |
| New ARR at $75K ACV | $6.0M | $9.0M |
| Annual SDR cost at $110K each | $5.5M | $2.2M |
| SDR cost per closed deal | $68,800 | $18,300 |
The assumptions: each SDR costs about $110K a year fully loaded and works about 1,000 accounts a year through a real multi-touch sequence. ACV is $75K, and 40% of meetings become qualified opportunities on both lists. The meeting and close rates are assumptions, and the Pain Addressable Market rates are higher because those accounts have a reason to finish the buying process. Cost per deal here only counts SDR cost, so it's not full CAC. Swap in your own numbers.
Twenty SDRs working the Pain Addressable Market book the same number of meetings as fifty working the TAM, close 50% more new ARR, and get SDR cost per closed deal down from $68,800 to $18,300. And I held meeting-to-opportunity conversion flat at 40%, which honestly flatters the TAM list. The thirty SDRs you don't need are $3.3M back on the P&L, or the capacity to open a second Pain Addressable Market while the first one keeps producing. In the TAM version, that nearly 4x cost per deal shows up in the board deck as an efficiency problem, and it typically gets blamed on rep performance or the channel, when really it's the list.
The thing you have to watch, though, is whether the Pain Addressable Market is big enough to actually keep your team busy. At 1,000 accounts per rep per year, a 20,000-account Pain Addressable Market carries twenty SDRs. The 80 to 150 data centers wouldn't have filled one SDR's quarter. Banking's 2,323 institutions were enough for our client's team, but a 50-SDR org would need several markets that size, and each one has to be sized before it gets staffed.
What can't this see?
Before we turned any of this into a repeatable method, we backtested the signal stack against the one bank customer our client already had. That bank signed after our client had already committed to exploring banking, and it landed inside the thesis, but its actual trigger was private. One of the bank's executives had already seen our client's product at work in a casino, and the bank happened to be looking for a fix at the teller line at the same time. No public dataset could have told us those two things were about to line up.
You can only detect pain that leaves evidence behind.
A signal engine can pick up changes in hiring, locations, financials, products and regulation, and it can connect those changes to the problem you solve. It can't see an internal conversation, an unannounced priority, or a chance encounter that happens behind closed doors. Our goal was never to predict every customer. It's to find the conditions you can observe and use them to find more accounts where the pain is likely and urgent enough to justify a conversation, knowing some of your best customers are still going to come from places no model would have pointed you.
Section 4How do you build your own Pain Addressable Market?
You work backward from the pain. Define the problem, figure out what evidence it leaves behind, score your TAM against that evidence, test the score against what actually happened, and check the result against your headcount before you staff it.
- Define the pain. Start with what your product does, then ask what gets worse if a company doesn't solve it. Lost revenue, fraud, slower production, whatever it is, that's where your Pain Addressable Market starts.
- Find its footprints. If the problem were really bad inside a company, what would you expect to see from the outside? Look at your best customers first and ask what makes them unusually exposed.
- Build proxies for what you can't see. For anything that isn't published, work through the Ladder of Proxies above, and keep track of which scores lean on a proxy.
- Backtest it. This is the step people skip the most. You can build a model that sounds super smart, but until you've checked it against what actually happened, it's still just a hypothesis. Run your candidate signals backward against the last 90 days and count how often they fired, and how often they fired on accounts you'd already scored high.
- Size it against your team. Take your Pain Addressable Market, divide by how many accounts a rep can really work in a year, and see how many reps it carries. If the answer is less than one, you don't have an outbound market yet.
- Watch for change. Now you set up monitoring for the events that move an account from your Pain Addressable Market into Accounts in Market, and use intent as a timing input on top of that.
And expect to fix it as you go. While we were building this for the banking client, we found a bug in the scoring logic. We fixed it, wrote down exactly what changed, and told the client which accounts moved because of it. Signals change, proxies get better and some of your hypotheses are going to turn out wrong, so you want a model people can question and correct, not one that looks finished.
Section 5How do you pitch this to your CRO?
If you're in RevOps, running sales development or carrying a book as an AE, this is honestly the best way I know of to start thinking like a CRO, because it's the same math they're already getting asked about by the board. I'd keep it to three slides.
- What the TAM is costing us. Your current TAM, meeting rate, close rate and SDR cost per closed deal. Most teams have never calculated that last number.
- The Pain Addressable Market. How many accounts, what you scored them on, and what the backtest showed.
- The capacity math. How many reps that Pain Addressable Market carries, what it does to cost per deal, and a specific pilot: one segment, one quarter, a handful of reps.
I'd lead with cost per deal. Your CRO might push back on how you built the signals, and that's fine, but cost per deal dropping by almost three-quarters is a hell of a number to dangle that could get the pilot approved.
Section 6Should you build it, buy it or hire someone?
Every team I talk to ends up at this question, and there isn't one right answer. If you buy an intent platform, you get the bottom two layers of the pyramid fast, but so does everybody else selling into your market. And let's be clear, you should buy an intent platform. It's super valuable data. If you build it, a good RevOps person with Clay and public data can absolutely get there, but the proxies and the backtesting take real time, and somebody has to keep the monitors running after the project is over. If you hire a consultancy, you can get a great model, but the work tends to leave when the engagement does unless they're managing the service for you.
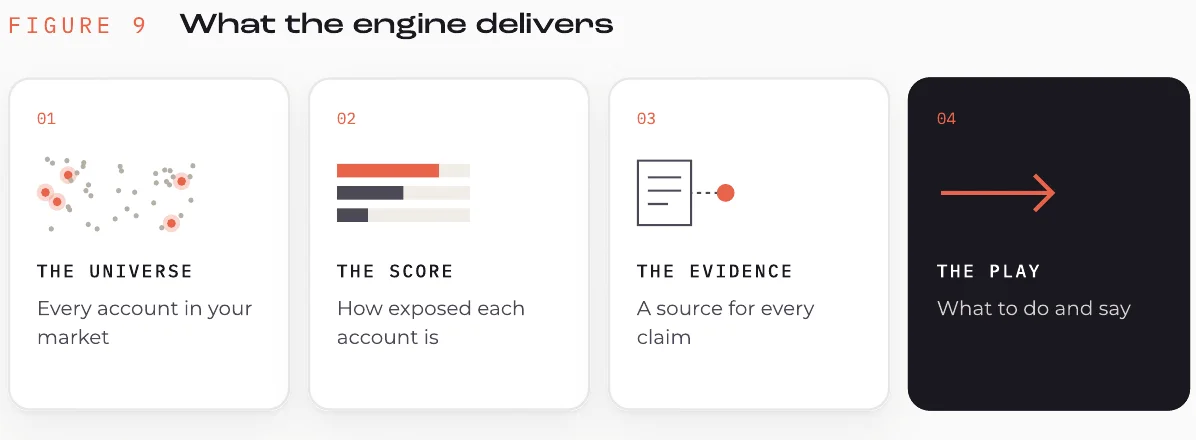
Whichever way you go, it helps to know what's actually being built. It isn't a list. It's a bespoke signal engine: a scoring model built around every pain your product solves, each one weighted by how much it matters, plus the proxies and monitors that feed it, and the backtests that prove it works. The list your reps work from is just what that engine puts out at any given moment.
If you want to build it yourself, the next piece is for you. This one was the thinking behind it, the mental model you need to apply to build it. The next one is the actual system: the data sources, the schema, the scoring model, the monitors, the pipeline, the QA process and the tooling you need to turn all of this into your own bespoke signal engine.
Report 02 is the build.
The data sources, the schema, the scoring model and the monitors behind everything in this report. Get it the day it ships.
Rather have us build it? Talk to us.